What are report design services?
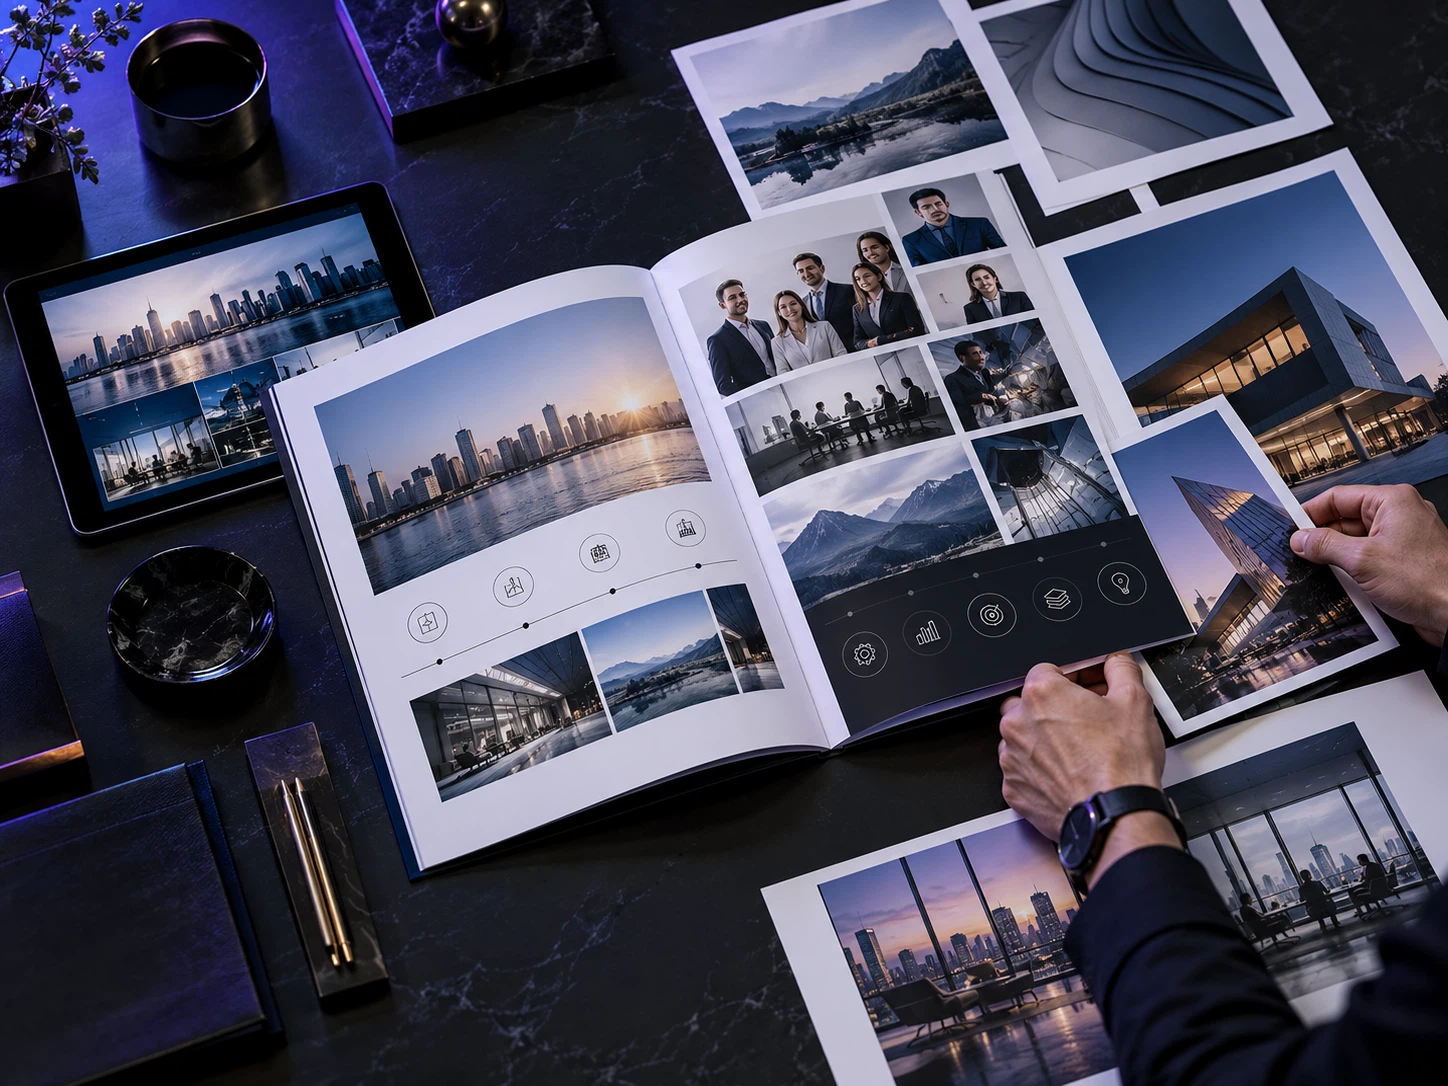
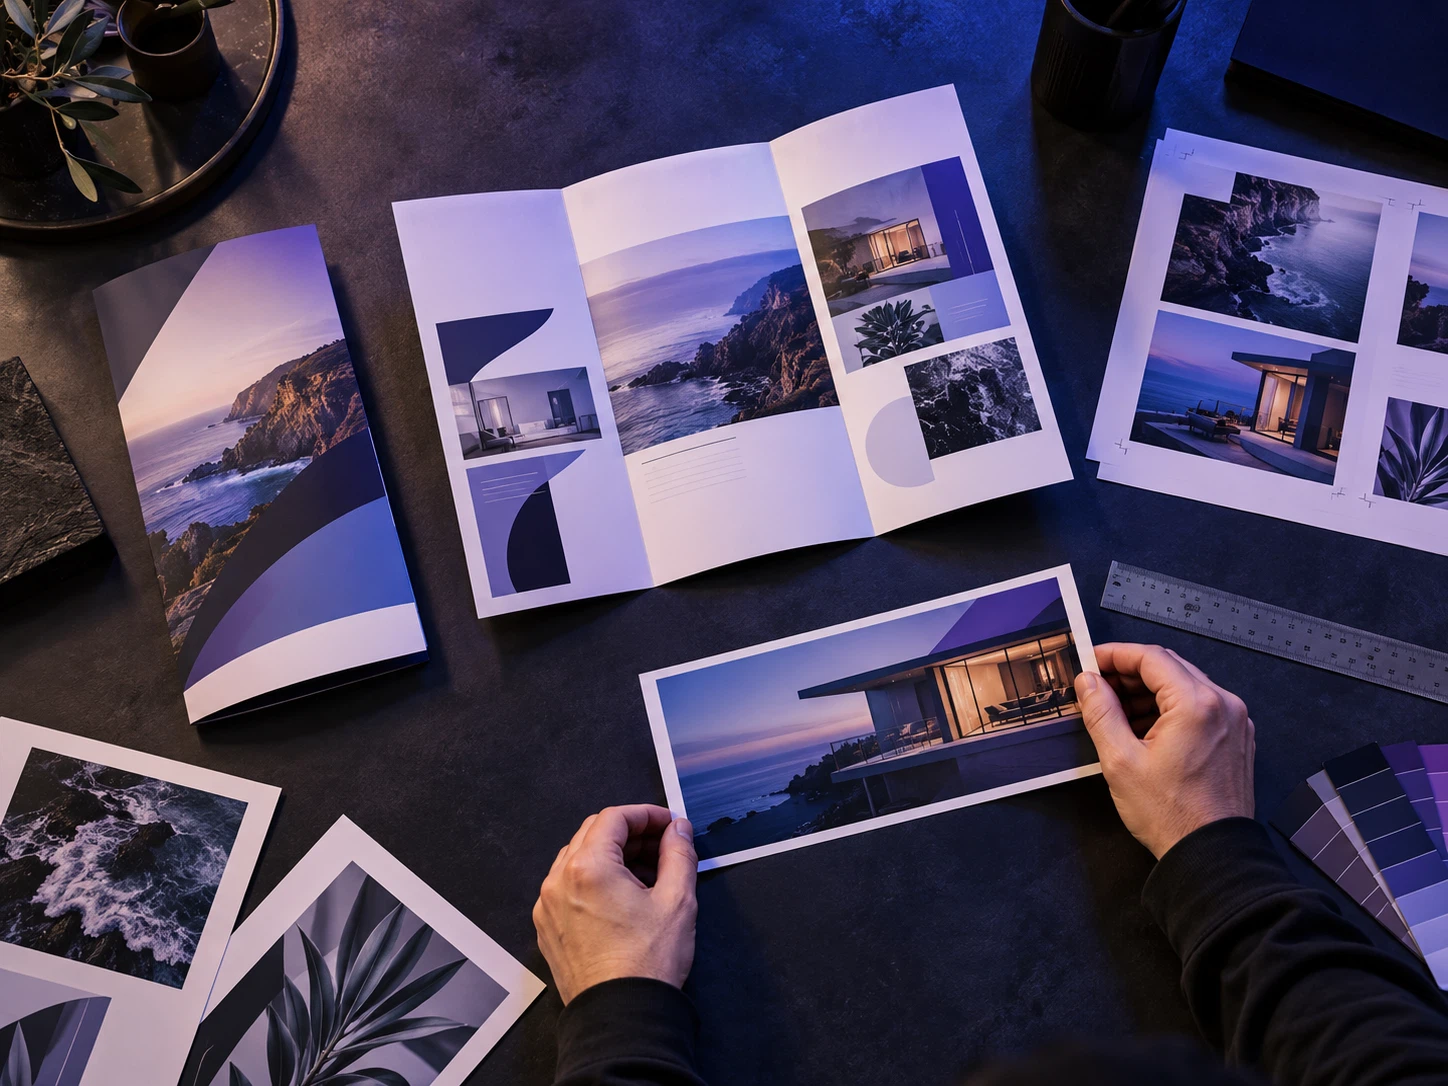
Report design services take a finished or nearly finished manuscript, plus the data behind it, and turn it into a document people can read quickly: a cover that frames the story, a contents page that matches the real sections, headings that say something, charts that summarize the numbers, and consistent styling in your brand from the first page to the last.
Design does not change your information. Its job is to decide what the reader sees first, what they can skip, and where they find detail when they need it. A board member should get the picture from the summary and KPIs in two minutes; an analyst should be able to jump straight to the table they care about.
That is also why the quality of any report starts with the quality of the content and data you hand over. Good annual report designers will push back on unclear sections before they lay out a single page.
Key takeawayReport design organizes and highlights your content and data; it does not change the information itself.

Which types of reports need professional design?
Reports differ in audience, length and data density, and each type has different design priorities.
Monthly and quarterly reports
Recurring reports live or die on a consistent template. KPIs should sit in the same place every period, compared with the last one, so readers know exactly where to look.
Performance and KPI reports
These show results against targets. They need clean charts, one color meaning "on track" and another meaning "behind" throughout, and a first page that answers leadership's question directly.
Project, event and program reports
They document what happened and what it achieved: numbers, photos, partners and outcomes. The balance between images and data matters, and so does a timeline that reads from start to result.
Annual reports
The longest and most formal type: leadership letter, highlights, KPIs, projects and a financial summary, read by boards, investors, members and donors. The design of an annual report needs a full visual system and an interactive contents page in the digital version. For structure and layout in depth, see our guide on how to design an annual report.
Company profiles
Not a report on a period but a sales document that introduces your company, services and past work. It is built with the same tools, which is why we price it in the same packages.
Key takeawayRecurring reports need a stable template, KPI reports need clear charts and annual reports need a complete visual system.

What makes a report look professional?
A professional report is not one with more decoration. It is one where readers find what they need fast. These are the points we check before any report goes out.
Clear structure
Lead with the conclusion, then the evidence. Every section opens with a heading that carries a message rather than a label like "Results", followed by a short summary and then the supporting numbers.
Honest data visualization
Bars for comparison, lines for change over time, one large number for a headline result, and a table only where readers need exact values. No cropped axes or 3D effects that exaggerate a small change.
Typography that reads well
A legible typeface with a few weights, comfortable line spacing, one consistent number style and properly aligned tables. In bilingual reports, Arabic text needs its own typeface and right-to-left layout.
Brand consistency
Your colors, fonts and icon style throughout, so the report feels like part of your website and decks rather than a one-off.
Accessibility
Real text rather than pictures of text, enough contrast, information that does not rely on color alone, and a logical reading order in the PDF. If a specific accessibility standard applies to your organization, raise it before design starts.
Print vs. interactive PDF
The print file is high resolution and set up for the printer. The digital version is lightweight enough to email and can be interactive, with a clickable contents page and links. Both are exported from the same design.
Key takeawayProfessional means fast to navigate and accurate in how it shows the numbers.

How does the report design process work?
Most of our report projects follow the same steps; how long each one takes depends on page count and how ready your content is.
- Confirm the report type, audience and page count, and pick the package that fits.
- Send all content: text, data, photos and brand files. The timeline starts here.
- We plan the sections and map content to pages before designing anything.
- We design the cover, contents page, interior pages and charts.
- Revision rounds, each one a consolidated set of feedback.
- Delivery of a share-ready PDF and a high-res print PDF, plus the source file where included.
Key takeawayPlanning sections before design and having all content in before kickoff save the most time.

What should you prepare before you order?
Our prices and timelines assume the core information comes from you. The more of this list is ready on day one, the faster and more accurate the result.
- Logo files in vector format, plus your brand colors and fonts.
- Final or near-final text in an editable document.
- The data behind every chart in a spreadsheet, not as screenshots.
- Project, team and product photos at the highest resolution you have.
- Last year's edition, if there is one, and examples of reports you like.
- One person who collects and approves feedback, and your deadline.
Key takeawaySend data as spreadsheets, text as editable files, and name one approver.

How much does report design cost?
Report design cost comes down to page count, how much writing is needed, how many charts are involved and which files you need at the end. Instead of open-ended estimates, we work with four fixed-price packages with set pages, timelines and revision rounds:
| Package | Best for | Pages | Timeline | Revisions | Price |
|---|---|---|---|---|---|
| JUST MINI | Short company profile for a startup, shop or salon | Up to 6 | 3–5 business days | 2 rounds | $106 |
| JUST REPORT | Monthly, quarterly, performance, project and event reports | Up to 12 | 5–7 business days | 2 rounds | $225 |
| JUST PROFILE | Full company profile or report with marketing copy | Up to 20 | 7–10 business days | 3 rounds | $474 |
| JUST ANNUAL | Annual report, including the editable source file | Up to 40 | 12–20 business days | 3 consolidated rounds | $1,190 |
Key takeawayFour fixed packages from $106 to $1,190, each with a listed extra-page rate.

How are extra pages and add-ons priced?
Page counts include the cover, table of contents and contact page. Extra pages are $16 each in MINI (2 max), $20 in REPORT (up to 16 pages total), $25 in PROFILE (up to 30 pages) and $32 in ANNUAL (up to 60 pages).
Add-ons
- Extra simple chart: $24. Custom infographic: from $53.
- Editable source file: $40 for MINI, $66 for REPORT, $106 for PROFILE; included in ANNUAL.
- Second-language edition, with the translation supplied by you: 40% of the package price.
- Extra copywriting from your information: from $66 per 500 words.
- Rush delivery, once we confirm the schedule works: +30%.
Annual report design cost: worked examples
A 6-page short profile is $106; 8 pages is $138. A 12-page report is $225; 14 pages is $265. A 20-page company profile is $474; 24 pages is $574. A 40-page annual report is $1,190; 50 pages is $1,510. These examples assume content within each package's level of complexity. Complex tables and dense financial data are quoted separately.
Key takeawayExtra pages run $16 to $32 depending on the package, and every add-on is priced before work starts.

What is not included in the price?
Being clear about exclusions prevents surprises later. The packages do not include printing, translation, specialized research, collecting or analyzing data from scratch, preparing or auditing financial statements, or a new logo or brand identity unless agreed as a separate service.
A revision round is one consolidated set of design feedback. It does not cover rebuilding the document or major content changes after approval. The digital PDF and the print PDF are two exports of one design, not two separate designs.
Key takeawayPrinting, translation, research, financial statements and new branding are separate services.
Common report design mistakes
These come up again and again in the reports we are asked to redesign. Avoiding them saves time and revision rounds.
- Starting design before the text and figures are approved, then reflowing pages after every change.
- Pasting spreadsheet tables as-is instead of picking the numbers that matter and charting them.
- Generic headings like "Introduction" and "Results" that tell the reader nothing.
- Too many colors that are not part of the brand, with color meanings that change from page to page.
- Sending a 60 MB print PDF by email and wondering why nobody opened it.
- Feedback from several people that contradicts itself within one round.
Key takeawayApprove content first, chart the numbers that matter and consolidate feedback.
Get your report or company profile designed
If you have a recurring report, an annual report or a company profile to design or refresh, see every package and add-on on our report and company profile design service page and pick the closest fit.
If the same content will be presented in a meeting, we can also turn it into a presentation deck in the same brand. Contact us with the document type, page count and deadline, and we will confirm the right package in writing before work starts.
Key takeawayPick the closest package on the service page, then send the type, page count and deadline to confirm it in writing.